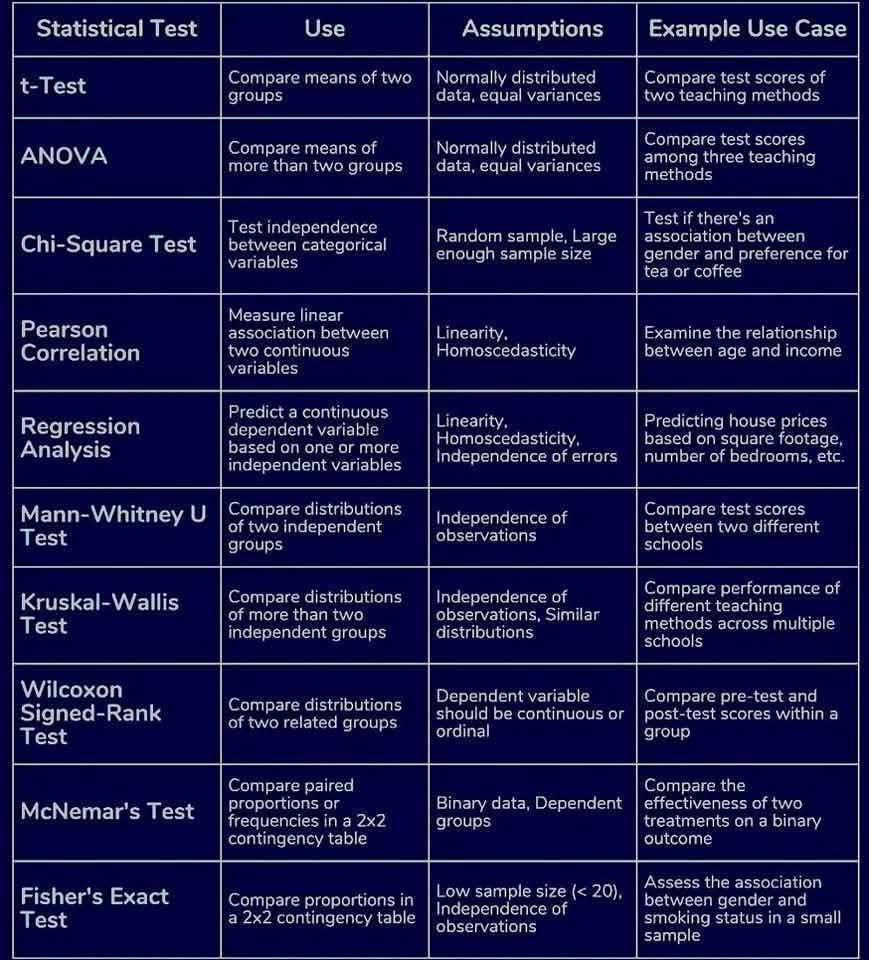
Accurate data analysis is the cornerstone of quality research. Choosing the right statistical test ensures that your conclusions are valid and meaningful. Whether you are comparing groups, examining relationships, or predicting outcomes, understanding the purpose and application of each test is essential. Here’s a concise guide to the most commonly used statistical tests and how they differ.
🔹 t-Test
Used to compare the means of two groups. It helps determine whether the observed difference between groups is statistically significant. Ideal for experiments comparing control and treatment groups.
🔹 ANOVA (Analysis of Variance)
Extends the t-test to more than two groups, allowing researchers to compare multiple means simultaneously. ANOVA identifies whether at least one group differs significantly from the others.
🔹 Chi-Square Test
Tests independence between categorical variables. Commonly used in surveys and observational studies to see if variables are associated or independent.
🔹 Pearson Correlation
Measures the linear association between two continuous variables. Values range from -1 to +1, indicating the strength and direction of the relationship.
🔹 Regression Analysis
Predicts a continuous dependent variable based on one or more independent variables. Regression helps identify trends, relationships, and influences within data.
🔹 Mann-Whitney U Test
A non-parametric alternative to the t-test, it compares the distributions of two independent groups when data do not follow a normal distribution.
🔹 Kruskal-Wallis Test
The non-parametric counterpart to ANOVA, used to compare distributions of more than two independent groups without assuming normality.
🔹 Wilcoxon Signed-Rank Test
Used to compare distributions of two related groups, such as pre-test vs post-test measurements on the same subjects.
🔹 McNemar’s Test
Compares paired proportions or frequencies in a 2×2 contingency table. Ideal for before-and-after studies with categorical outcomes.
🔹 Fisher’s Exact Test
Used to compare proportions in a 2×2 contingency table, especially when sample sizes are small and the Chi-square test assumptions are not met.
💡 The Bottom Line
Mastering statistical tests allows researchers to make informed decisions, validate hypotheses, and draw reliable conclusions. Selecting the appropriate test based on your data type and research question is key to rigorous quantitative research.
🔔 Follow PAK Ink Publications on Instagram and Facebook for graduate study tips, research guidance, and resources to enhance your academic journey!