The Core Purpose
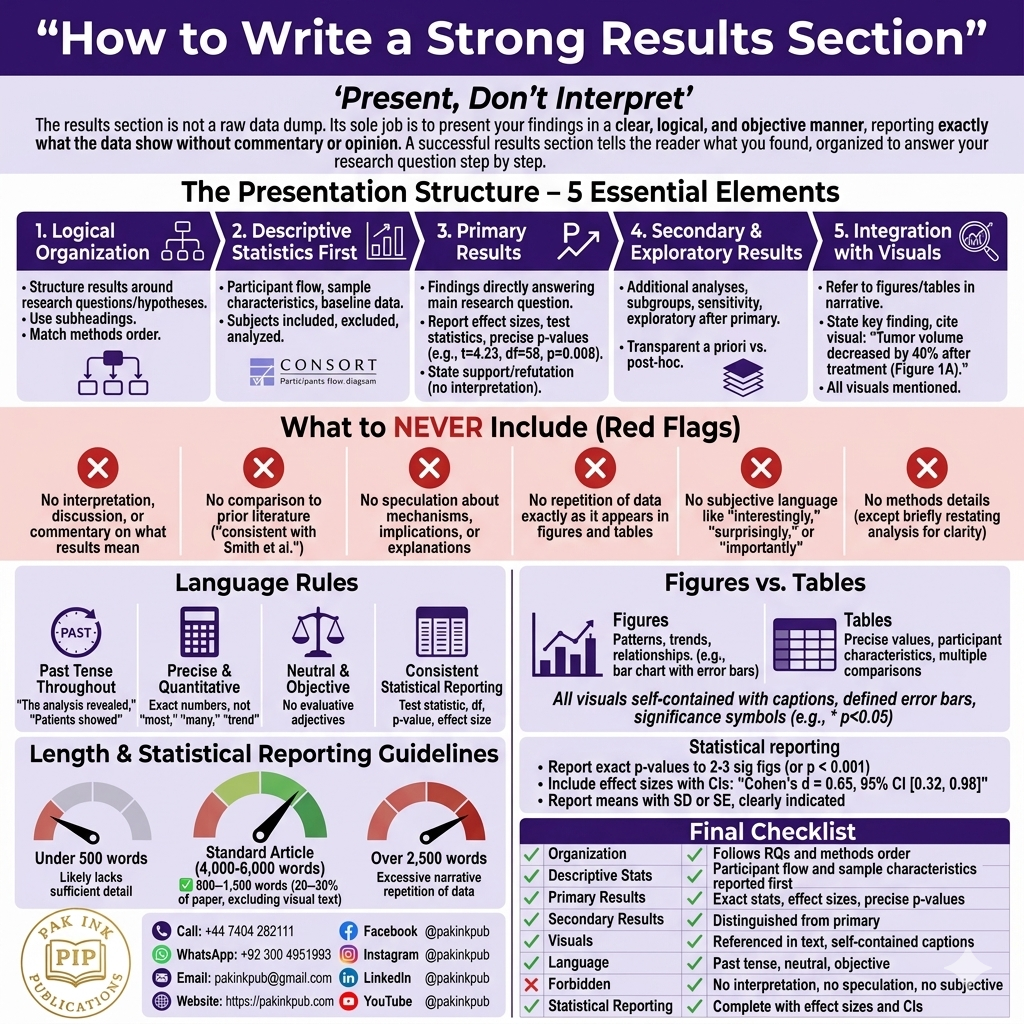
The results section is not a raw data dump or a place to interpret your findings. Its sole job is to present your findings in a clear, logical, and objective manner, reporting exactly what the data show without commentary or opinion. A successful results section tells the reader what you found, using a combination of narrative text, figures, and tables, organized to answer your research question step by step.
What MUST Be in a Good Results Section (The Presentation Structure)
A strong results section follows the logical flow of your methods and research questions, not the order you performed the analyses. It should contain five essential elements. 1) A Logical Organization: Structure the results around your research questions or hypotheses. Use clear subheadings to guide the reader. Present results in the same order as the methods section so readers can easily match procedures to findings. 2) Descriptive Statistics First: Begin with participant flow, sample characteristics, and baseline data. Report how many subjects were included, excluded, and analyzed. For a clinical trial, include a CONSORT flow diagram. For descriptive data, report means with standard deviations, medians with ranges, or frequencies with percentages as appropriate. 3) Primary Results (The Core Findings): Present the results that directly answer your main research question. Report effect sizes, test statistics, and precise p-values (e.g., t = 4.23, df = 58, p = 0.008; not merely p < 0.05). Include confidence intervals where relevant. State whether findings support or refute your hypothesis, but do not interpret why. 4) Secondary and Exploratory Results: Present additional analyses, subgroup findings, sensitivity analyses, or exploratory results after the primary findings. Be transparent about which analyses were planned a priori and which were post-hoc. 5) Integration with Visuals: Refer to figures and tables within the narrative. Do not simply say “Results are shown in Figure 1.” Instead, state the key finding and then cite the figure: “Tumor volume decreased by 40% after treatment compared to baseline (Figure 1A).” Every figure and table must be mentioned in the text, and every mention must lead the reader to a specific visual.
What MUST NOT Be in a Good Results Section
No interpretation, discussion, or commentary on what the results mean (save that for the Discussion). No comparison to prior literature (e.g., “This finding is consistent with Smith et al.”). No speculation about mechanisms, implications, or explanations. No raw data unless presented in tables or supplementary materials (the narrative text should summarize, not list every data point). No repetition of data exactly as it appears in figures and tables (use text to highlight key findings, not to repeat all values). No methods details that belong in the methodology section, except when briefly restating a specific analysis to aid clarity. No subjective language like “interestingly,” “surprisingly,” or “importantly.” No inclusion of results that are not tied to your stated research questions without justification. No discussion of outliers or data exclusions without having described the criteria in the methods section.
What Kind of Language Should Be Used?
Use past tense throughout, as the analyses have already been completed (e.g., “The analysis revealed,” “Patients in the treatment group showed”). Be precise and quantitative: report exact numbers, not vague quantifiers like “most,” “many,” or “a trend toward.” Use neutral, objective language without evaluative adjectives. Use consistent reporting formats for statistical results (e.g., always report test statistic, degrees of freedom, p-value, and effect size). Use subheadings to organize the narrative and guide the reader through the findings.
Complementary Elements (What is Often Included or Excluded)
Included are figures (graphs, images, diagrams), tables (organized data summaries), and supplementary materials (additional analyses, extended data). Figures and tables must be self-contained with clear captions that allow a reader to understand them without reading the main text. Included also are statements about preregistered analyses versus exploratory analyses to distinguish confirmatory from hypothesis-generating findings. Excluded from the results section are any discussion of implications, citations to other studies, methodological justifications, or speculative explanations of findings. Excluded are raw data files (those go to repositories or supplementary materials), though summary data belong in tables.
How to Present Data
Figures and tables are not interchangeable. Use figures to show patterns, trends, relationships, and distributions (e.g., line graphs, scatter plots, bar charts with error bars, survival curves). Use tables to present precise numerical values, participant characteristics, or multiple comparisons that readers may need to look up. Ensure all visuals are high resolution, clearly labeled, and consistent in style. Error bars must be defined in the caption (e.g., “error bars represent ± SEM”). Indicate statistical significance with symbols or annotations (e.g., * p < 0.05, ** p < 0.01) and define them in the caption.
Length
How Long Should the Results Section Be? The results section typically comprises 20-30% of the total paper length, though this varies by field and the complexity of the data. For a standard 4,000-6,000 word research article, the results section (excluding figures and tables) is often 800-1,500 words. The word count should be driven by the data: a simple study with one primary outcome may have a shorter results section; a complex study with multiple experiments, subgroups, and sensitivity analyses will be longer. A results section under 500 words for a full-length article likely lacks sufficient detail. A results section over 2,500 words (excluding visuals) may indicate excessive narrative repetition of data already presented in tables and figures. The guiding principle is clarity and completeness without redundancy.
Reporting Statistics Correctly
Report exact p-values to two or three significant figures unless p < 0.001 (then report as p < 0.001). Include effect sizes with confidence intervals (e.g., Cohen’s d = 0.65, 95% CI [0.32, 0.98]). Report means with standard deviations or standard errors, clearly indicating which is used. For complex models (e.g., regression, ANOVA), report the full model results including coefficients, standard errors, test statistics, and p-values. Avoid reporting only p-values without effect sizes or direction of effect.
Summary Checklist for a High-Quality Results Section
Element Requirement
Organization follows the research questions and methods order. Descriptive statistics and participant flow are reported first. Primary results are presented clearly with exact statistics and effect sizes. Secondary and exploratory results are distinguished from primary findings. Figures and tables are referenced in the text and are self-contained. Past tense used throughout. No interpretation, discussion, or comparison to prior literature. No repetition of data already visible in visuals. Statistical reporting is complete and precise. Length is appropriate to complexity (typically 800-1,500 words for a standard article, plus figures and tables). A reader can understand exactly what you found without needing to read the Discussion.